Introducing Webpack Dashboard
> How about a nice game of chess?
As a child, I always wanted to be a hacker. I remember the first time my father showed me how to dir /p. I thought I was hacking the planet. Then I grew up, and I realized the reality of it was a bit different. I still use the CLI all the time, but it’s far less glamorous in daily use than it had been portrayed in film & media during my childhood.

But that doesn’t mean we still can’t have fun. I needed some command line nostalgia in my life, so I made it happen and I’m here to introduce Webpack Dashboard.
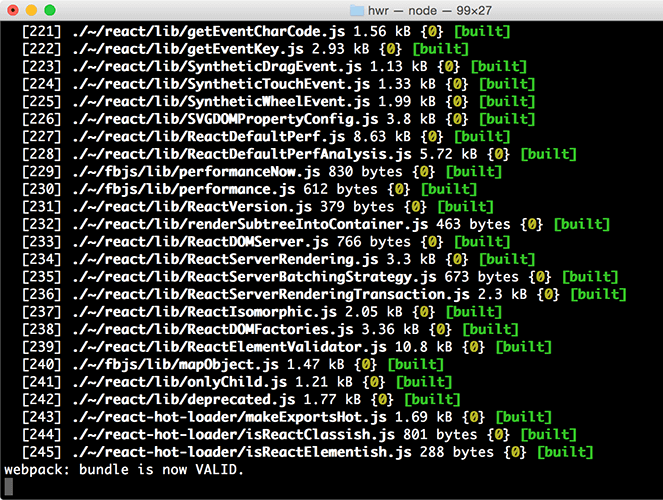
If you use webpack with regularity, specifically the webpack-dev-server or webpack-dev-middleware, you are probably used to seeing something like this:

Now don’t get me wrong, its a great collection of information, but I’ve always found it to be hard to derive any useful information from it without waiting for it to finish and then scrolling upwards until I could find the information I wanted.
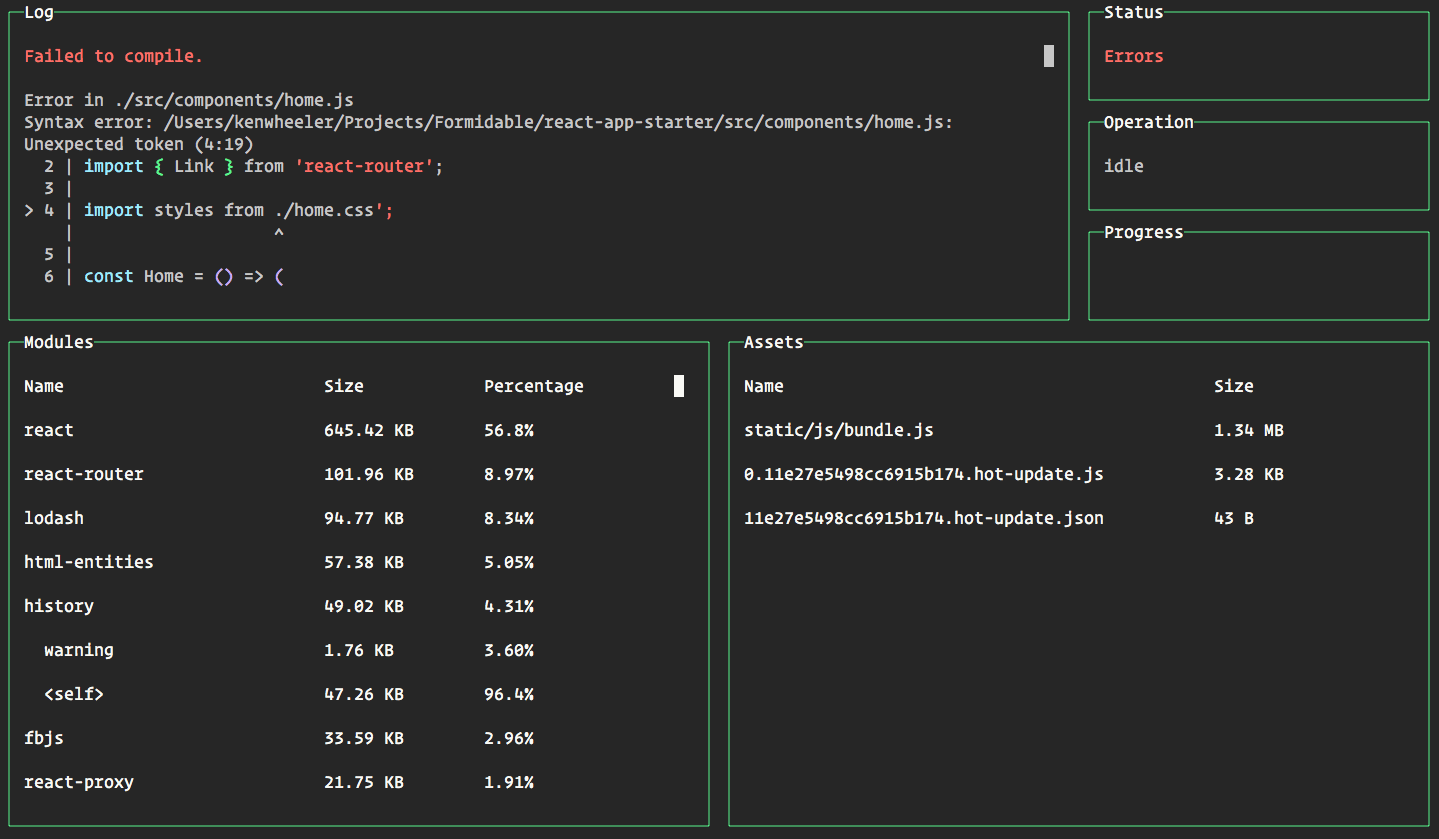
A while back, I came across a library called blessed, that lets you easily create command line interfaces for things like dashboards. I had tinkered with it, but didn’t really have a great dashboard idea. Until now. I realized this sort of thing would actually really help organize and intuitively display dev server output, so I created webpack-dashboard. Here is what your dev server output can look like now:

Check it out in action:

For the initial release, we have the following features:
- Log: Logs errors from the build process
- Status: The status of the build process
- Operation: The specific operation taking place in the build process
- Progress: Live build progress
- Modules: A list of your modules, their sizes and percentage of bundle size
- Assets: A list of assets output from the build
So if you want to give it a spin, head on over to:


